Banners: Overview

click to enlarge
Statistics Overview
In this graph you will see an overview of the statistics of your banners based on views and clicks. You can display chart with stats by years, months or days. Default is days. Choose a date range to show desired statistics chart. Switch between bar and line charts.
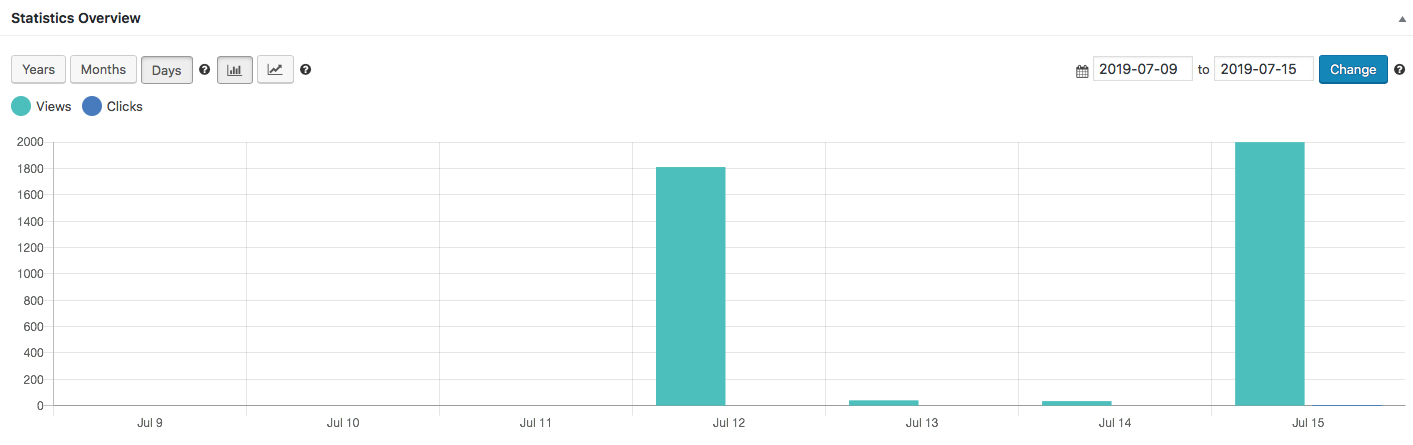
1. Days
Display the chart with stats below by days. An example chart:

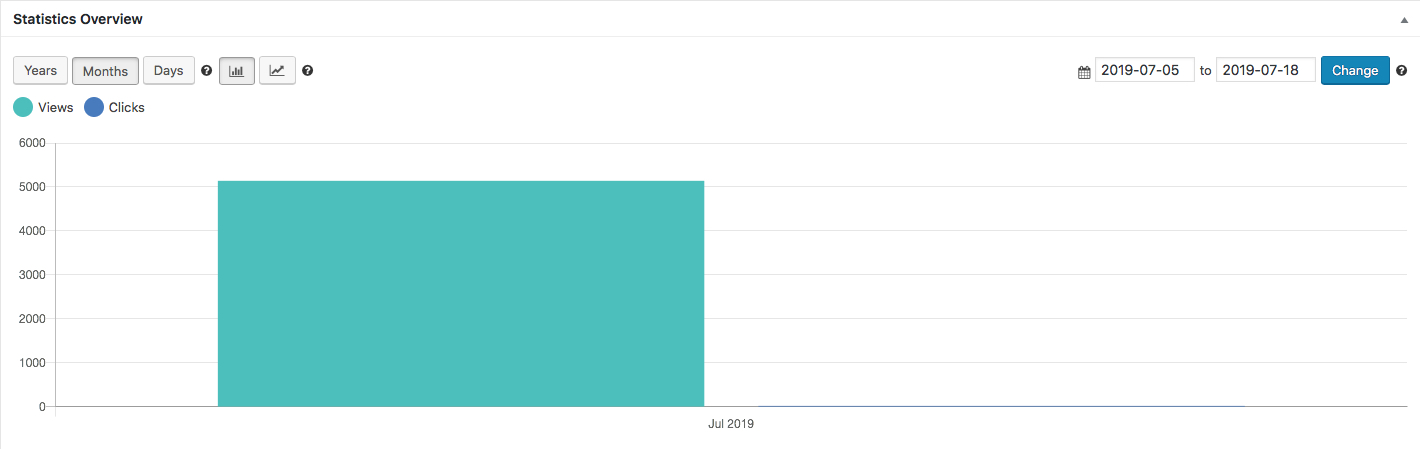
2. Months
Display the chart with stats below by months. An example is shown for July 2019:
3. Years
Display the chart with stats below by years. An example is shown for the year of 2019:

click to enlarge
4. Display stats chart as bar
You can switch between bar and lines for stats display. An example of bars display:
click to enlarge
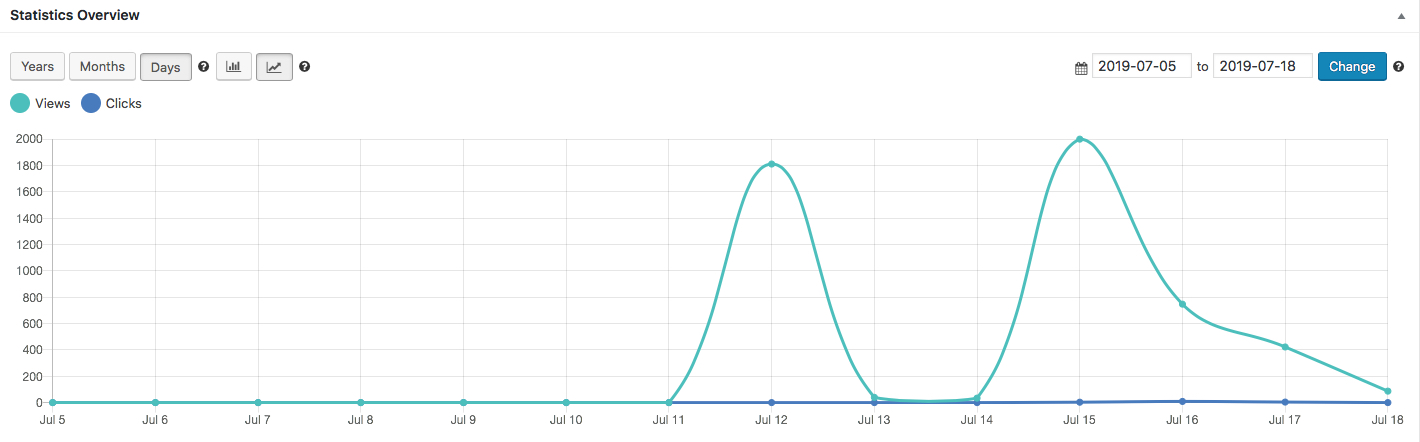
5. Display stats chart as line
You can switch between bar and lines for stats display. An example of line display:
click to enlarge
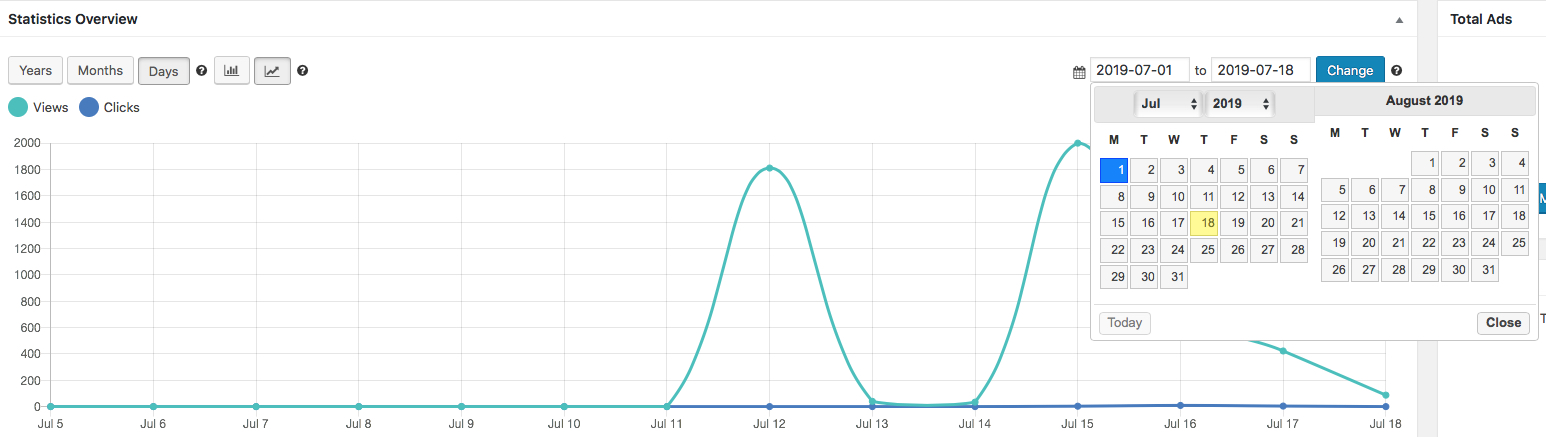
6. Create a date range
By default, the chart will show stats for the last 30 days, including today. Use the two date inputs to choose a from and to date to create a range. An example chart:
click to enlarge

Devices Overview
A pie cart with text will display views and clicks of your banners on different devices.
Ads not running

In this section of the overview you will see all ads not running and the reason. You will be able to edit or delete the banner.
Perform bulk actions on multiple banners at a time. You will be able to delete, activate, deactivate, reset clicks, reset views etc.
Other
 On the left hand side of your overviews section you will find these stats that will show the total number of ads, zones and sizes.
You will be able to manage ads, zones and sizes by clicking on the buttons below the stats.
Earn Money by Referring People
Refer customers to us with your affiliate link and earn commission on sales from your link.